Python
Whether you’re new to Python or are an experienced Python coder interested in how other Fred Hutch members work with this language, this page is for you! Here we share information on learning Python, accessing python either locally or via remote computing at Fred Hutch, and overviews of a few common software options for running and writing Python code.
Please also see our Resource Library for tutorials on a variety of Python topics, including checkpointing on Gizmo, logging in Python, running tensorflow, and more!
Common Python packages for scientific research computing
Packages (sometimes also referred to as libraries or modules) are collections of related functions created and made available by the Python community via Pypi.org. The following packages are commonly used for scientific computing and are pre-installed in the fhPython module.
numpyandscipyare complementary packages including many functions relevant for scientific computing. More information is available on the Scipy site. These packages are also used in fredhutch.io’s Intermediate Python: Programming class.pandasis the Python Data Analysis Library, which includes capabilities for parsing, manipulating, and summarizing spreadsheet-style data as data frames. More information is available in this introduction.pandasis also used in fredhutch.io’s Intro to Python class.biopythonis a package that allows easier manipulation of genetic and genomic data. Learn more using this Biopython tutorial.
There are many other packages publicly available for use, which may vary in quality and functionality. Other places to find packages:
- https://pypi.org
- install via github
- write your own (link to software development page)
Please see our Python Module page for more information on packages installed on our shared compute cluster.
Accessing and using Python
Installing Python on your own computer
If you are new to coding and just getting started with Python the easiest way to install Python on your workstation is to use either Miniforge or uv. uv is relatively new but has shown some significant interest in the Python community.
Use the instructions for installing Miniforge from conda-forge project and then configure as described here. More information on Conda installers is also available on Centernet (VPN required)
Using Python on rhino
To access Python on the Fred Hutch computing cluster, you will need to load a Python module. Each Python build is based on different version. Once a module is created it is not modifed and as many historic versions are available as possible. Thus identifying if an existing Python build matches your needs is a first step to using Python on the cluster.
module avail Python/3
module avail fhPython
SciComp maintains a custom version of Python named fhPython. fhPython has over 1,000 pre-installed libraries, many of which have been requested by Fred Hutch staff. The Scientific Software Inventory provides a list of Python modules and detailed information about libraries included with each version.
Python inventory.
If you do not see the software you desire, email scicomp to request it or add your own GitHub issue in the easybuild-life-sciences GitHub repository.
In your request, please include a link to the package source and version you require.
Alternatively, you
can install the package in your home directory with the --user option (e.g. pip3 install --upgrade --user mypkg),
or to create a virtual Python environment, for example:
    username@rhino01:~$ ml fhPython/3.8.6-foss-2020b-Python-3.8.6
    username@rhino01:~$ python3 -m venv ~/mypython
    username@rhino01:~$ source ~/mypython/bin/activate
    (mypython) username@rhino01:~$ #python code executed in mypython environment
    (mypython) username@rhino01:~$ deactivate
    username@rhino01:~$
Using Jupyter on rhino
Recommended: Use Open OnDemand for the easiest way to launch Jupyter Lab.
There have been many iterations of Python Labs (or Notebooks), starting with IPython. SciComp currently supports Jupyter. The Jupyter user interfaces offer a foundation of interactive computing environments where scientific computing, data science, and analytics can be performed using a wide range of programming languages.
JupyterLab (formerly Notebook) is a minimal but very capable web-based interactive computational environment. JupyterLab is the newest version that replaces Notebook. It has a modular structure where you can open several notebooks or files (e.g. HTML, Text, Markdown etc) as tabs in the same window. It offers more of an IDE-like experience and can be extended through extensions. Jupyter is covered in more depth in the Python IDE Comparison section below.
Jupyter Lab
NOTE: Jupyter Labs were formerly known as Notebooks. Labs can do everything notebooks could do and more. If you are used to using the jupyter notebook command, use jupyter lab instead.
We supply a JupyterLab module. It does not
by itself include packages that many people will want for bioinformatics and
data science work. Here’s are some example commands which will load
scipy, numpy, matplotlib, pandas, scikit-learn, and many others, along with JupyterLab:
After you have connected to rhino, run these commands:
    username@rhino01:~$ ml purge
    username@rhino01:~$ ml JupyterLab/4.0.3-GCCcore-12.2.0  Seaborn/0.12.2-foss-2022b scikit-learn/1.2.1-gfbf-2022b
    username@rhino01:~$ jupyter lab --ip=0.0.0.0 --port=$(fhfreeport) --no-browser
You will see output like this:
   To access the server, open this file in a browser:
        file:///home/example-url...
    Or copy and paste one of these URLs:
        http://rhino01:16053/example-url...
Copy the second link, the one that starts with http:// and the name of the machine you are connected to. Paste it into your browser and you will see the JupyterLab interface.
If you would like to use a different version of Python than what is in the default JupyterLab module, run ml avail JupyterLab then load the specific module you want. For example, if you wanted to use Python 3.8 you would use ml JupyterLab/2.2.5-foss-2020a-Python-3.8.2 in place of ml JupyterLab above. You’d need to make sure that the other packages you need are compatible; contact scicomp@ for assistance.
Python IDE comparison
While it is possible to write and run Python code entirely from the command line, most Python programmers use an integrated development environment, or IDE, to write, test, and run code. An IDE is a type of software that facilitates common programming tasks, and makes it easier to write, test, and run code. This section describes a few of the most common Python IDEs used at the Hutch, including additional features members of our community have found helpful.
If you’re using any of the training materials listed in the section above, they will likely recommend a specific IDE. Your choice of how to write and run Python code for your own research, however, largely depends on personal preference, and your project’s computational needs,
and the manner in which you want to interact with your code and its output. If you are not sure about where to run Python (on your own computer, rhino, or gizmo), you should consider where your data are located (thus, whether it will need to be downloaded/transferred), what packages you’ll need (and how to install/access them), and what kind of coding work you’ll be doing (developing code, or running batch jobs).
The sections below describe some of the most popular methods for installing and running Python at Fred Hutch, both on your own computer and on the Hutch’s high-performance computing resources. Below, you’ll find more in-depth comparisons of the features associated with a few of the most common Python IDEs:
Visual Studio Code
Visual Studio Code (VS Code) is a code editor developed by Microsoft that is intended as a streamlined, lightweight solution for writing, debugging, and version control of scripts. VS Code is the preferred IDE for most members of Fred Hutch’s Scientific Computing group; they may be able to help with troubleshooting during their office hours if you require assistance. This following demo is adapted from original content written by Kosh Mayer-Blackwell while a member of the Fred Hutch research community.
Setup
This demonstration requires the following setup:
- Install Visual Studio Code
- Add the following four key extensions by clicking on the four box icon in the left sidebar, searching for the extension by name, and installing:
Code Runner 0.9.16,Python,R,markdownlint - Ensure you have a Python >= 3.6 environment available.
For more information on setting up Python in VS Code, as well as more features available, please see VS Code’s documentation for Python.
Shortcuts
The following shortcuts represent especially handy features in VS Code, though many are also accessible in the right-click menu, with additional shortcuts viewable by scrolling over the relevant icon. For a complete description of how to maximize productivity using VS Code, please see VS Code’s Keyboard Shortcuts and VS Code Navigation.
-
Reveal file location: Click on the file name in the file explorer panel, then use
Alt + Cmd + Cto copy the full path (e.g./Users/username/folder/filename) to your clipboard. Alternatively, useAlt + Cmd + Rto show the file in Finder (Mac) or Windows Explorer. -
Save or close multiple files: The icons (and correpsonding keyboard shortcuts) above the filenames in the file explorer panel allow you to save or close all open files with a single click.
-
Preview files in markdown: To view live rendering of markdown files, like
README.mdright-click on your markdown file and select Open Preview. -
Run script or only part of script: Run a segment of a script by selecting the part you care about and hitting
Ctrl + Cmd + N. The results show up in the OUTPUT table. -
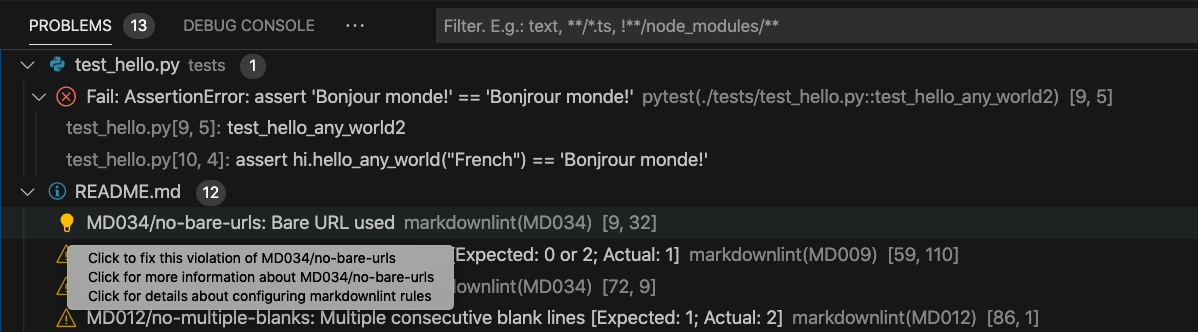
Identify problems and quick fixes: Code linters help you quickly find possible syntactical and stylistic problems, such as trailing spaces and bare URLs. Issues detected by the built-in VS Code linter are reported in the Problems tab (see below), which you can access using the shortcut
Shift + Cmd + M.
Script Debugging
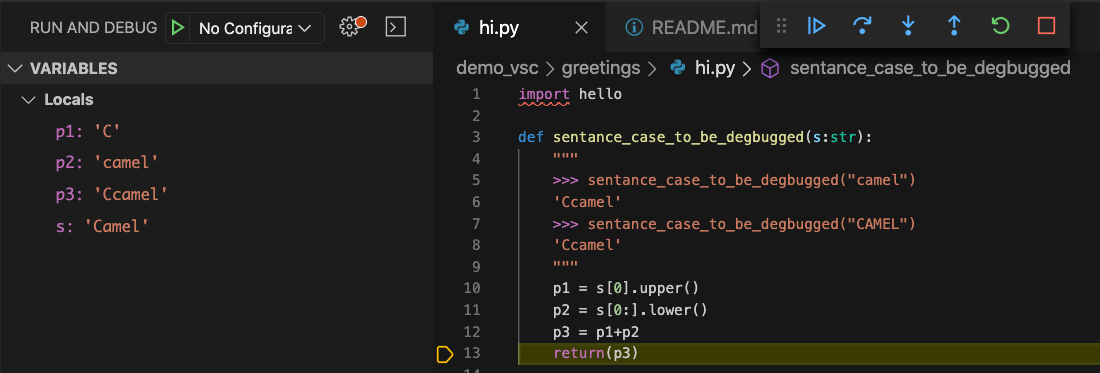
Let’s suppose we see an error after running a python script named hi.py:
Traceback (most recent call last):
  File "greetings/hi.py", line 51, in <module>
    assert sentence_case_to_be_debugged("Camel") == "Camel"
AssertionError
If we wanted to see at what point in the script that error emerged,
we could view breakpoints using fn + F9,
or by using the mouse to click in the left margin in the editor.
Then, click the Bug with the play icon,
so we can start at the source of the error and move inwards
The breakpoint is placed on line 51 at the source of the error:

“Step Into” the error (that is, go to the function being called) by clicking on the downward blue arrow. Then, step line by line through the problematic function and check whether state of all variables meet your expectations.
For more information, check out the debugging section of the VS Code documentation
Develop a Specific Unit Test
A great thing about VS Code is how it organizes your tests. You can even run them one by one.

Also here is an easter egg if you like doctests:
pytest --doctest-modules -v
For more information, see Python testing in Visual Studio Code.
Peek
Sometimes you don’t want to search for where a variable or function is defined.
VS Code has a Peek function that lets you examine externally referenced objects, and even edit them, directly from where an object is referenced.
The images below illustrate the use of Peek in a script named hello.py:

See the VS Code documentation for more information on Peek.
SSH Extension for remote development
If you’ve ever had to access and work on files through a remote connection you’ve probably found yourself at the mercy of the development tools provided on the remote server you’re accessing. Luckily VS Code has a well-supported extension which can allow you to enjoy the same development experience on a remote server that you would if you were developing locally. Follow the step-by-step instructions on setting up the Visual Studio Code Remote - SSH to get set up to run VS Code when connected to a remote server.
Linux integration
The Visual Studio Code Remote - WSL extension is a related extension which allows you to use VS Code with the Windows Subsystem for Linux. This can greatly simplify using Linux toolchains and utilities from within a Windows environment.
Git integration
VS Code allows access to a [few different types of version control software(https://code.visualstudio.com/docs/editor/versioncontrol)]. Git is the most frequently used at the Hutch, and the VS Code Git integration includes a few nice options for dealing with common tasks.
For example, let’s look at resolving a merge conflict. A merge conflict often arises when two users commit changes to the same file. For instance, on GitHub, I wrote:
I think we should think global!
But on my laptop, I wrote:
I think we should start local!
When I tried to, push the second commit, my push was rejected:

So I pulled the version on GitHub that was one commit ahead, revealing a conflict without an auto-resolution. Git cannot merge two versions of the same file, if they have different content on the same line! How would git know which was correct?

Fortunately, VS Code makes it easy to review the conflict and pick the winner (or keep both, by appending a version as new lines of code).

After resolving the conflict, remember to commit and push the resolution.
User-specific settings
JSON file with all your user-specific settings. How to get to it? (see the common settings wheel at the lower left)

PyCharm
PyCharm is an incredibly powerful IDE created by JetBrains.
It comes in a free, open-source community edition,
with upgraded version available via subscription,
and can be downloaded here.
This section is adapted from original content written by Zach Romer while a member of the Fred Hutch research community.
Keyboard shortcuts
A complete list of keyboard shortcuts can be configured in the Preferences > Keymap menu. If you’re a hotkey ninja (which I am not),
you can get set up to keep your hand off the mouse almost completely. There are vim and emacs keymap plugins
which will allow you to use your respective setups in PyCharm as well.
The following shortcuts are some of the most unusual or useful available in PyCharm:
-
Cmd + Kwill bring up a commit dialog box, listing all the files that have been modified. You can uncheck the checkbox next to each file that you don’t want included in the commit. A diff viewer will be present for each file changed, allowing you to see how the file changed for this commit. -
fn + Shift + Kwill bring up the push menu, and will include a list of all the commits which will be pushed as a result of this action, as well as the ability to view the diffs that will be applied to each changed file. -
Cmd + Bwill take you to the closest (scope-wise) definition of a variable you have highlighted, whether that’s in the current function or deep in some third-party library in your virtual environment. I find this one to be invaluable when trying to trace back clues as to why an object isn’t behaving the way I think it should, and overall better understand how those objects work. -
Alt + Shift + Ewill allow you to execute any highlighted code in an IPython console which will automatically appear. The console will contain the state of any state from previous code executions in that console, but can be easily reset using the ‘return’ button along the Python Console toolbar. This is super handy for testing small snippets of code while you’re developing. -
Shift + Cmd +Iwill open up a small peek window with a view of the definition of an object or class you have highlighted. This is in contrast toCmd + B, which will take you directly to the module and location of the declaration of the highlighted object. An example of the first option is shown below.

Object inspection, completion
When working with objects that may have lots of methods on them, it can be easy to forget what methods are available.
By simply typing a variable which has been prior been assigned a type (through just assigning it a value, Py3 method signature type hints,
or in-line type hints) and typing the . operator, a list of all properties and methods of that variable will appear in a drop-down.
Furthermore, once you’ve selected a method and are beginning to feed it parameters, you can type Cmd + P from within the method parentheses to list all the parameters the function takes. If you’d like to know more about how the function itself
works, you can jump to its definition by highlighting it and typing Cmd + B
Setting the Python environment
By associating your project with a Python interpreter (whether it’s a global installation, or some conda/venv/pipenv install) your IDE
will be better able to perform proper syntax highlighting and will also be able to do cool things like run tests and execute
scripts or selected code blocks. You can even create multiple run / test configurations with different versions of Python in case you’d like to test across any differences between versions.
To set a Python environment, open PyCharm > Preferences from the toolbar.
From the Project drop-down select Project Interpreter. From here you can create a new conda/pipenv/venv environment for
this project (generally good practice) or select an existing interpreter on your computer. To create a new environment,
or link an existing interpreter to PyCharm select Add from the menu that appears when you click the gear next to the
Python Interpreter drop-down menu.

From the next pane you can create a new conda/pipenv/venv or link PyCharm to an existing interpreter / environment by browsing directly to its location on your computer, which makes it available to select in the Project Interpreter drop-down menu on the previous page.
Running code through the IDE
Once you have a Python interpreter associated with your project you should be able to right-click on any .py file selected from the project navigator and select Run. Any output from your project will appear in a terminal window which should appear when the file is run. You can customize Run configurations for each executable file, providing things like command-line arguments, environment variables and further environment setup by selecting Run > Edit Configurations from the top toolbar,
Debugging support
A file can be run with a debugger attached that will stop the program at any breakpoints you’ve placed by selecting a file,
and selecting Run > Debug… from the top toolbar, or right-clicking on the file from the project navigator and clicking Debug file.py.
Breakpoints can be placed on any line of code by clicking in the gutter next to the line number, or using the shortcut Cmd + F8.
Once you’ve entered the debugger and have stopped at a line a powerful array of tools are available to do things like
execute a single line, step over lines, inspect / watch variable values, and explore variable attributes or execute arbitrary
code in the breakpoint context.
Testing
PyCharm’s testing abilities really help make this project shine. From within the Preferences menu you have can select Tools > Python Integrated Tools. From here you can choose your favorite test runner (mine happens to be pytest)), which will tell PyCharm what tool to use when detecting and running tests in your project.

By going to the Test Configurations menu under the Run menu dropdown you can make custom test run configurations for particular modules or scripts, with different test runners or runtime parameters and environment setups.
Test debugging
While debugging doesn’t always have to occur during a unit test, they often go hand in hand. Say you’ve got a test that is failing and you just don’t know why. Don’t you which you could freeze the test right in the middle, inspect the variables and see which one contains the erroneous value that is making the test puke?
To drop a breakpoint into a test, simply click on the gutter to the left of the line you want to stop at. This will place
a red dot where the code will stop when we attach a debugger. Now when you go to click the play button on the test,
right-click and select Debug test_stuff.py. This will attach a debugger to the test runner, which will stop the code
every time it sees one of the red dots in the gutter. When the test stops you’ll have a few windows pop up in the bottom
of the IDE, one containing the current stack frames, and on containing any locally-defined variables and their value.
You can also add variables to a watch list from this window, so that if the test traverses many functions you can
keep track of the value of an interesting variable. Collections and objects in the Variables window will
give you the ability to drill-down through their attributes as well if you would like to further interrogate them.

This picture shows the debugger stopping the program prior to executing the line 13 assert rand > 2 and the debugger context
which appears at the bottom of the screen, containing the current call stack, a list of all variables found in the context
of the breakpoint which allows you to easily explore the attributes and values of nested objects, and a similar watch context
for following a particular variables value across different scopes.
Refactoring
Remember when you thought raccoon would be a funny name for a variable? And then that raccoon persisted throughout the project,
leaving its trail everywhere and leaving you and your teammates to try to figure out what a raccoon object is in the context
of bioinformatics? PyCharm makes refactoring of variable / object names extremely easy. Simply highlight the variable
or object you want to rename, click Refactor, then click Rename. PyCharm will then search for any reference
to that variable and present you with a list of all the places throughout the entire project that the highlighted variable occurs. If you’d like to rename
all of them, click Do Refactor. I’ve found this incredibly useful for changing object names to be more
clear about their purpose, without having to hunt through scores of modules to determine where they occur.
Find Usages
Sometimes you find a seemingly important variable or method that might need to be changed, but have no idea where or how it’s being used. By highlighting the object, right-clicking and clicking Find Usages, a small pop-up window will show where that variable is referenced throughout the entire project. This is particularly helpful for when you’re cleaning up code and want to know if you can delete something.
Right-clicking an object opens a menu which contains the Find Usages button:

After clicking the Find Usages button, a pane will open listing all the usages of that object found throughout the
project, presented in a tree-like fashion. Double-clicking on any of these usages will take you directly to that location
in the code.

Customized lint-hinting
PyCharm comes with a huge number of different of type and style hints to conform to PEP-8 and avoid some logic errors, particularly if you use the Python 3 type declarations in your code. Missing parentheses, brackets, bad indentation, unused variable detection, unreachable code, possibly uninitialized variables being used all can be reported with varying levels of severity. Which hints to receive, as well as their presentation attributes, can be set in the Preferences menu under the Editor tab.
Git integration
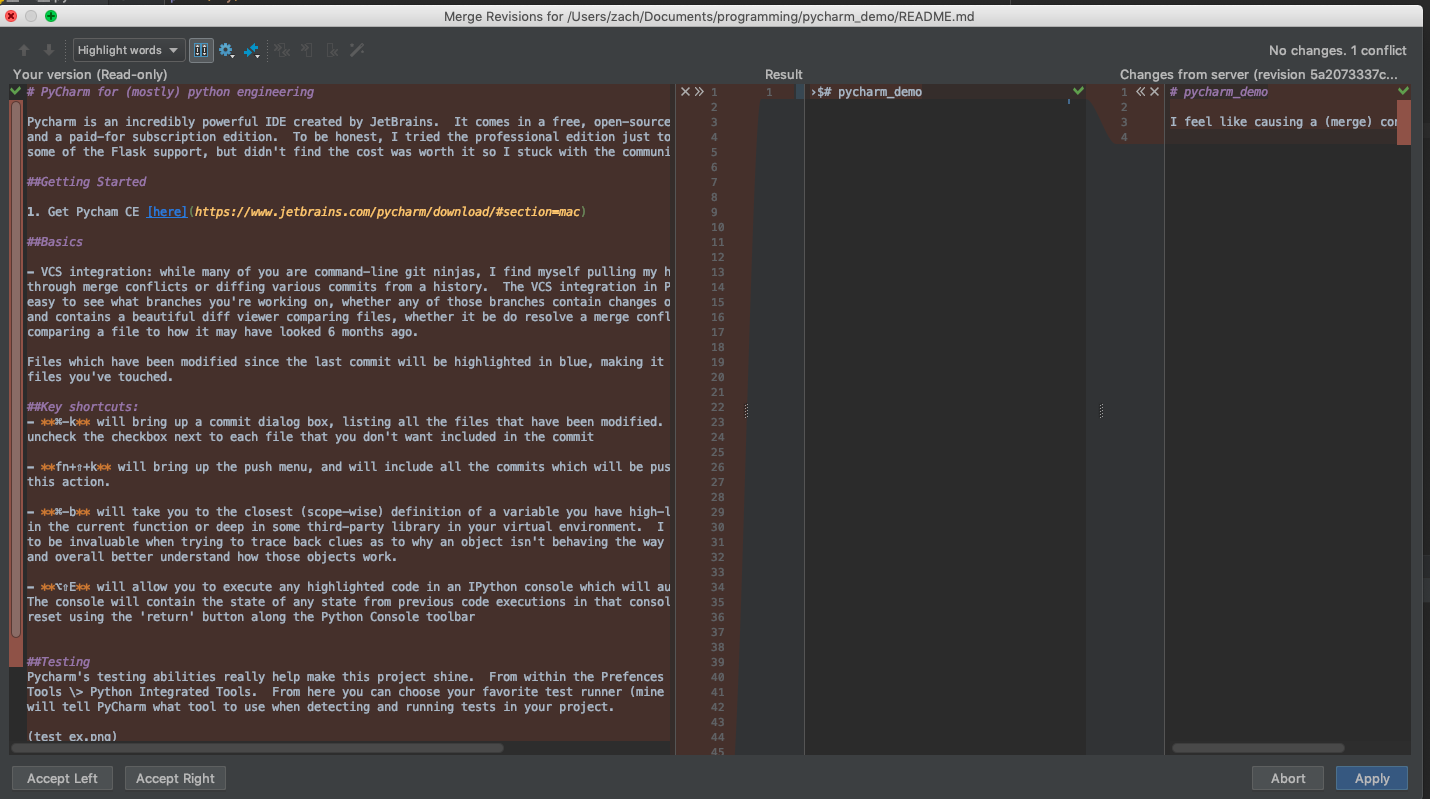
While many of you are command-line git ninjas, I find myself pulling my hair out paging through merge conflicts or diffing various commits from a history. The VCS integration in PyCharm makes it easy to see what branches you’re working on, whether any of those branches contain changes others don’t, and contains a beautiful diff viewer comparing files, whether it be do resolve a merge conflict, or while comparing a file to how it may have looked 6 months ago.
Files which have been modified since the last commit will be highlighted in blue, making it obvious what files you’ve touched.
Diff window comparing two conflicting files and showing the file resulting from how you merge the conflict.
You also have the ability to look through the git revision history of any module or folder by selecting the folder / module, right-clicking and selecting Git > Show history…

This allows you to see the various concurrent branches of development for the file, as well as a diff viewer showing the commit diff at each commit. This can be super handy when trying to find where a problem was introduced, or if you need to roll back to a specific commit before your last merge.
Installing plugins
From the top toolbar, select PyCharm > Preferences > Plugins. There are a myriad of plugins to help smooth out your development experience,
such as database connectors, AWS log and CLI plugins, Docker management tools, various language support plugins, hotkey keymap setups, color schemes and more.
Jupyter Notebook extension
PyCharm is capable of running Jupyter Notebooks. This is far from my area of expertise, but the community edition of PyCharm does appear to support it. A very basic jupyter notebook file is included in this project repo to show that it can be done. The kernel running the Jupyter Notebook can be configured similarly to how a test runner is configured. Go to the Run window drop-down, click Edit Configurations.. and select an item from the drop-down below Jupter Notebooks on the left side of the window that appears.
README writing
When writing any markdown file (ending with .md), PyCharm automatically picks it up as a markdown file and gives you the option to view the rendered markdown side-by-side with your markdown file as you create it.
Extensions
There are lots of various plugins for PyCharm that can be accessed through the Preferences tab, for various things like vim keyboard mappings, SQL highlighting and completion, bash completion, ticketing-service integrations, etc.
I’ve played with the youtrack extension before, and it was pretty neat once I got it up and running. It allowed me to create
branches from within PyCharm linked to an issue listed on youtrack, and then commits I made to that branch would show
up as links in the youtrack ticket. I could also close the ticket after merging the feature back in. They have a number of other
issue tracker integrations, including JIRA, Trello, and GitLab.
There are also various tools to enable easier development in cloud applications.
Other languages
PyCharm attempts to provide basic code highlighting and completion (like closing tags in HTML) in various languages, including HTML, SQL, and Docker. The professional version provides better syntax highlighting for things like Django and Jinja2 templates (and I think some light-weight javascript highlighting?), but I didn’t really find them worth it when I did my 30-day free trial of the professional version. There are many active community plugin projects for supporting tons of various languages.
Jupyter
Jupyter is an open-source project developed by community consensus. Project Jupyter develops two products we’ll discuss:
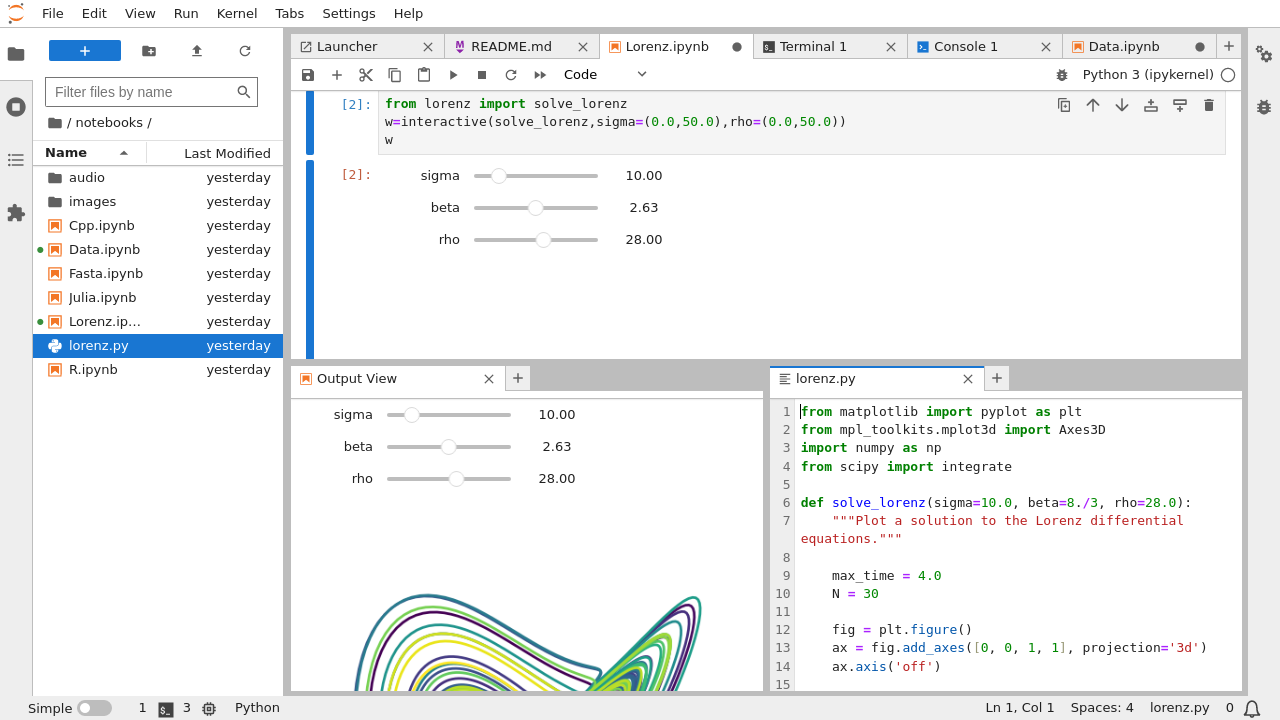
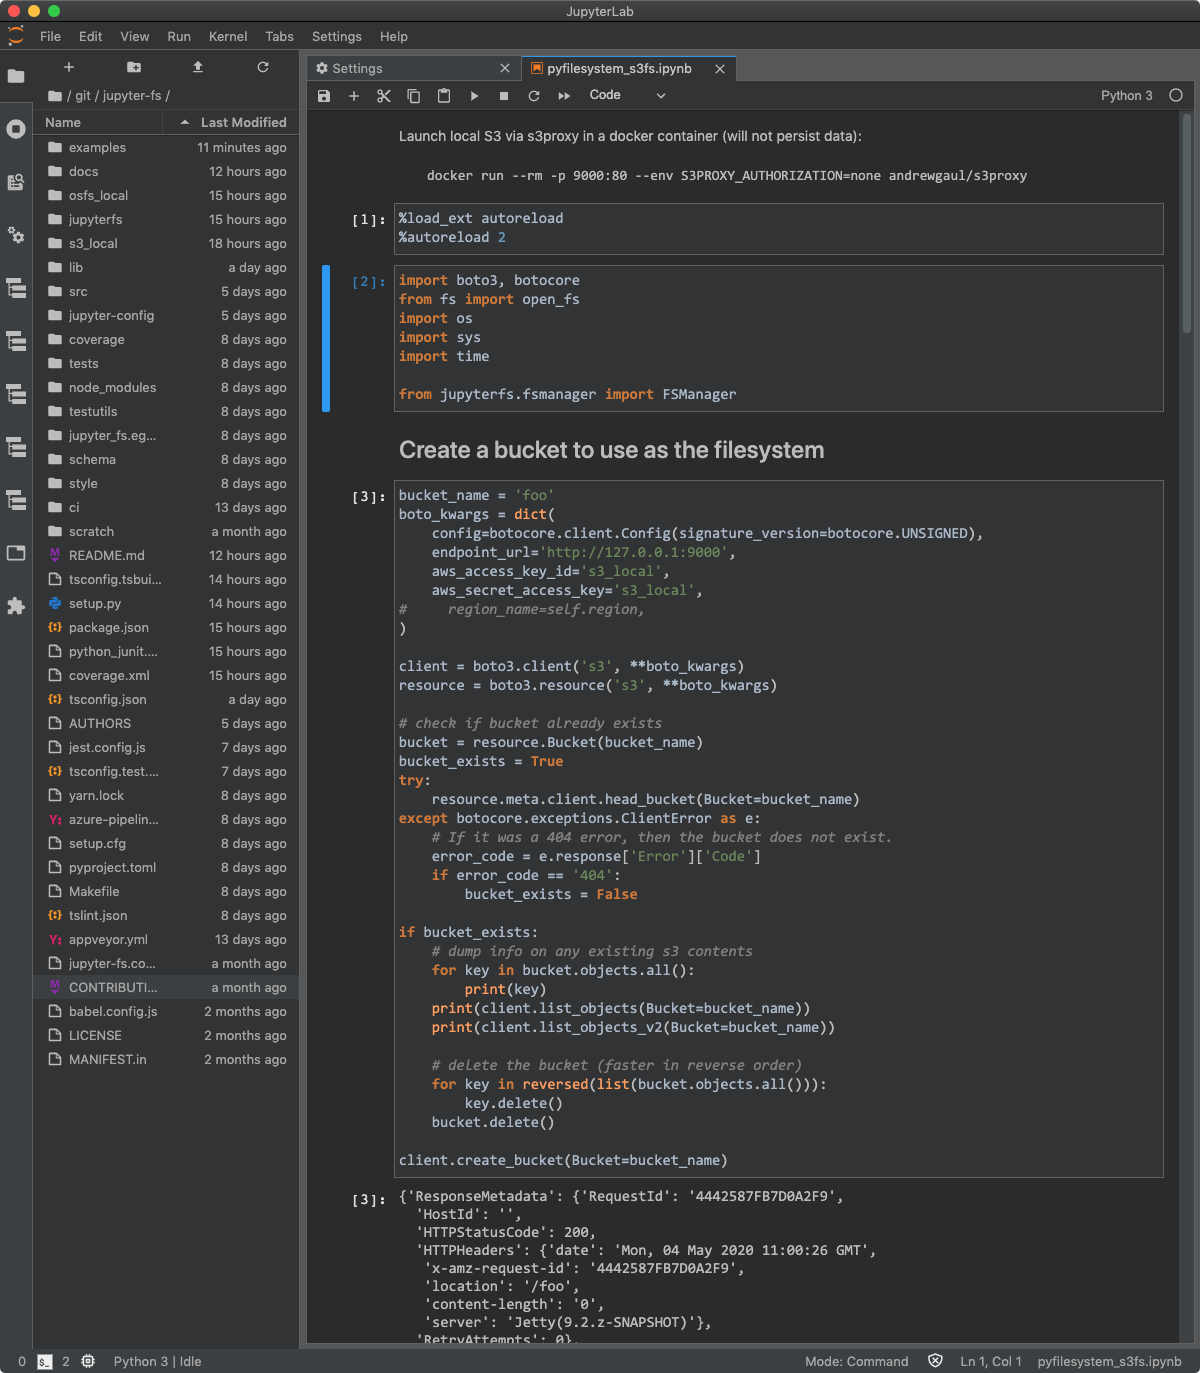
- JupyterLab: a web-based interface that allows interactions with Jupyter Notebooks, text editors, terminals, and more.
This image shows multiple windows for different parts of the JupyterLab interface:
- Jupyter Notebooks: human-readable documents including code (and its output) along with rich text elements. They allow the user to write code in small, executable chunks that can be interspersed with blocks of markdown. They are particularly well suited to exploring data and generating narrative-style presentations of analyses. They are most commonly used by data scientists who would like to experiment with their code and easily generate charts and graphs. JupyterHub is a multi-user version of Jupyter notebooks used for collaboration, which functionally operates like a notebook.
At Fred Hutch there are at least four ways to interact with Jupyter Notebooks, including the most recent (and recommended) incarnation called JupyterLab. See the above section on Accessing and using Python for more information.
This section is adapted from original content written by Justin Burge while a member of the Fred Hutch research community.
Setup
This demonstration assumes the following installation:
- JupyterLab: Check for the latest installation! JupyterLab is currently being actively developed, with many additional extensions allowing additional functionality that may not be described here. For information on the latest changes, please see the JupyterLab Changelog.
- By default JupyterLab installs Python. Additional features we’ll discuss here include:
- A linter such as flake8
- A debugger
- Github integration
- The variable inspector
- And for those that use R as well there’s an R kernel so you can run R in JupyterLab. That’s nice.
Some of these extensions/add-ons described here are not as frequently updated as the core JupyterLab product and may not be available with the latest version of JupyterLab. Please keep this in mind when installing and working with these tools.
Once you get JupyterLab and relevant extensions updated, you’ll have a light and functional web-based IDE. Check out options for customization via Settings > JupyterLab Theme, including a dark theme!
the .ipynb file
This IS the iPython notebook file or your JupyterLab file with code and markdown in it and note you can only access these from the directory you execute jupyterlab in so either pwd to make sure or have a set location of where you save the files because you’ll only be able to open .ipynb files in either the start-up directory or its sub-folders.
Keyboard shortcuts
Some helpful shortcuts for working in JupyterLab are the following:
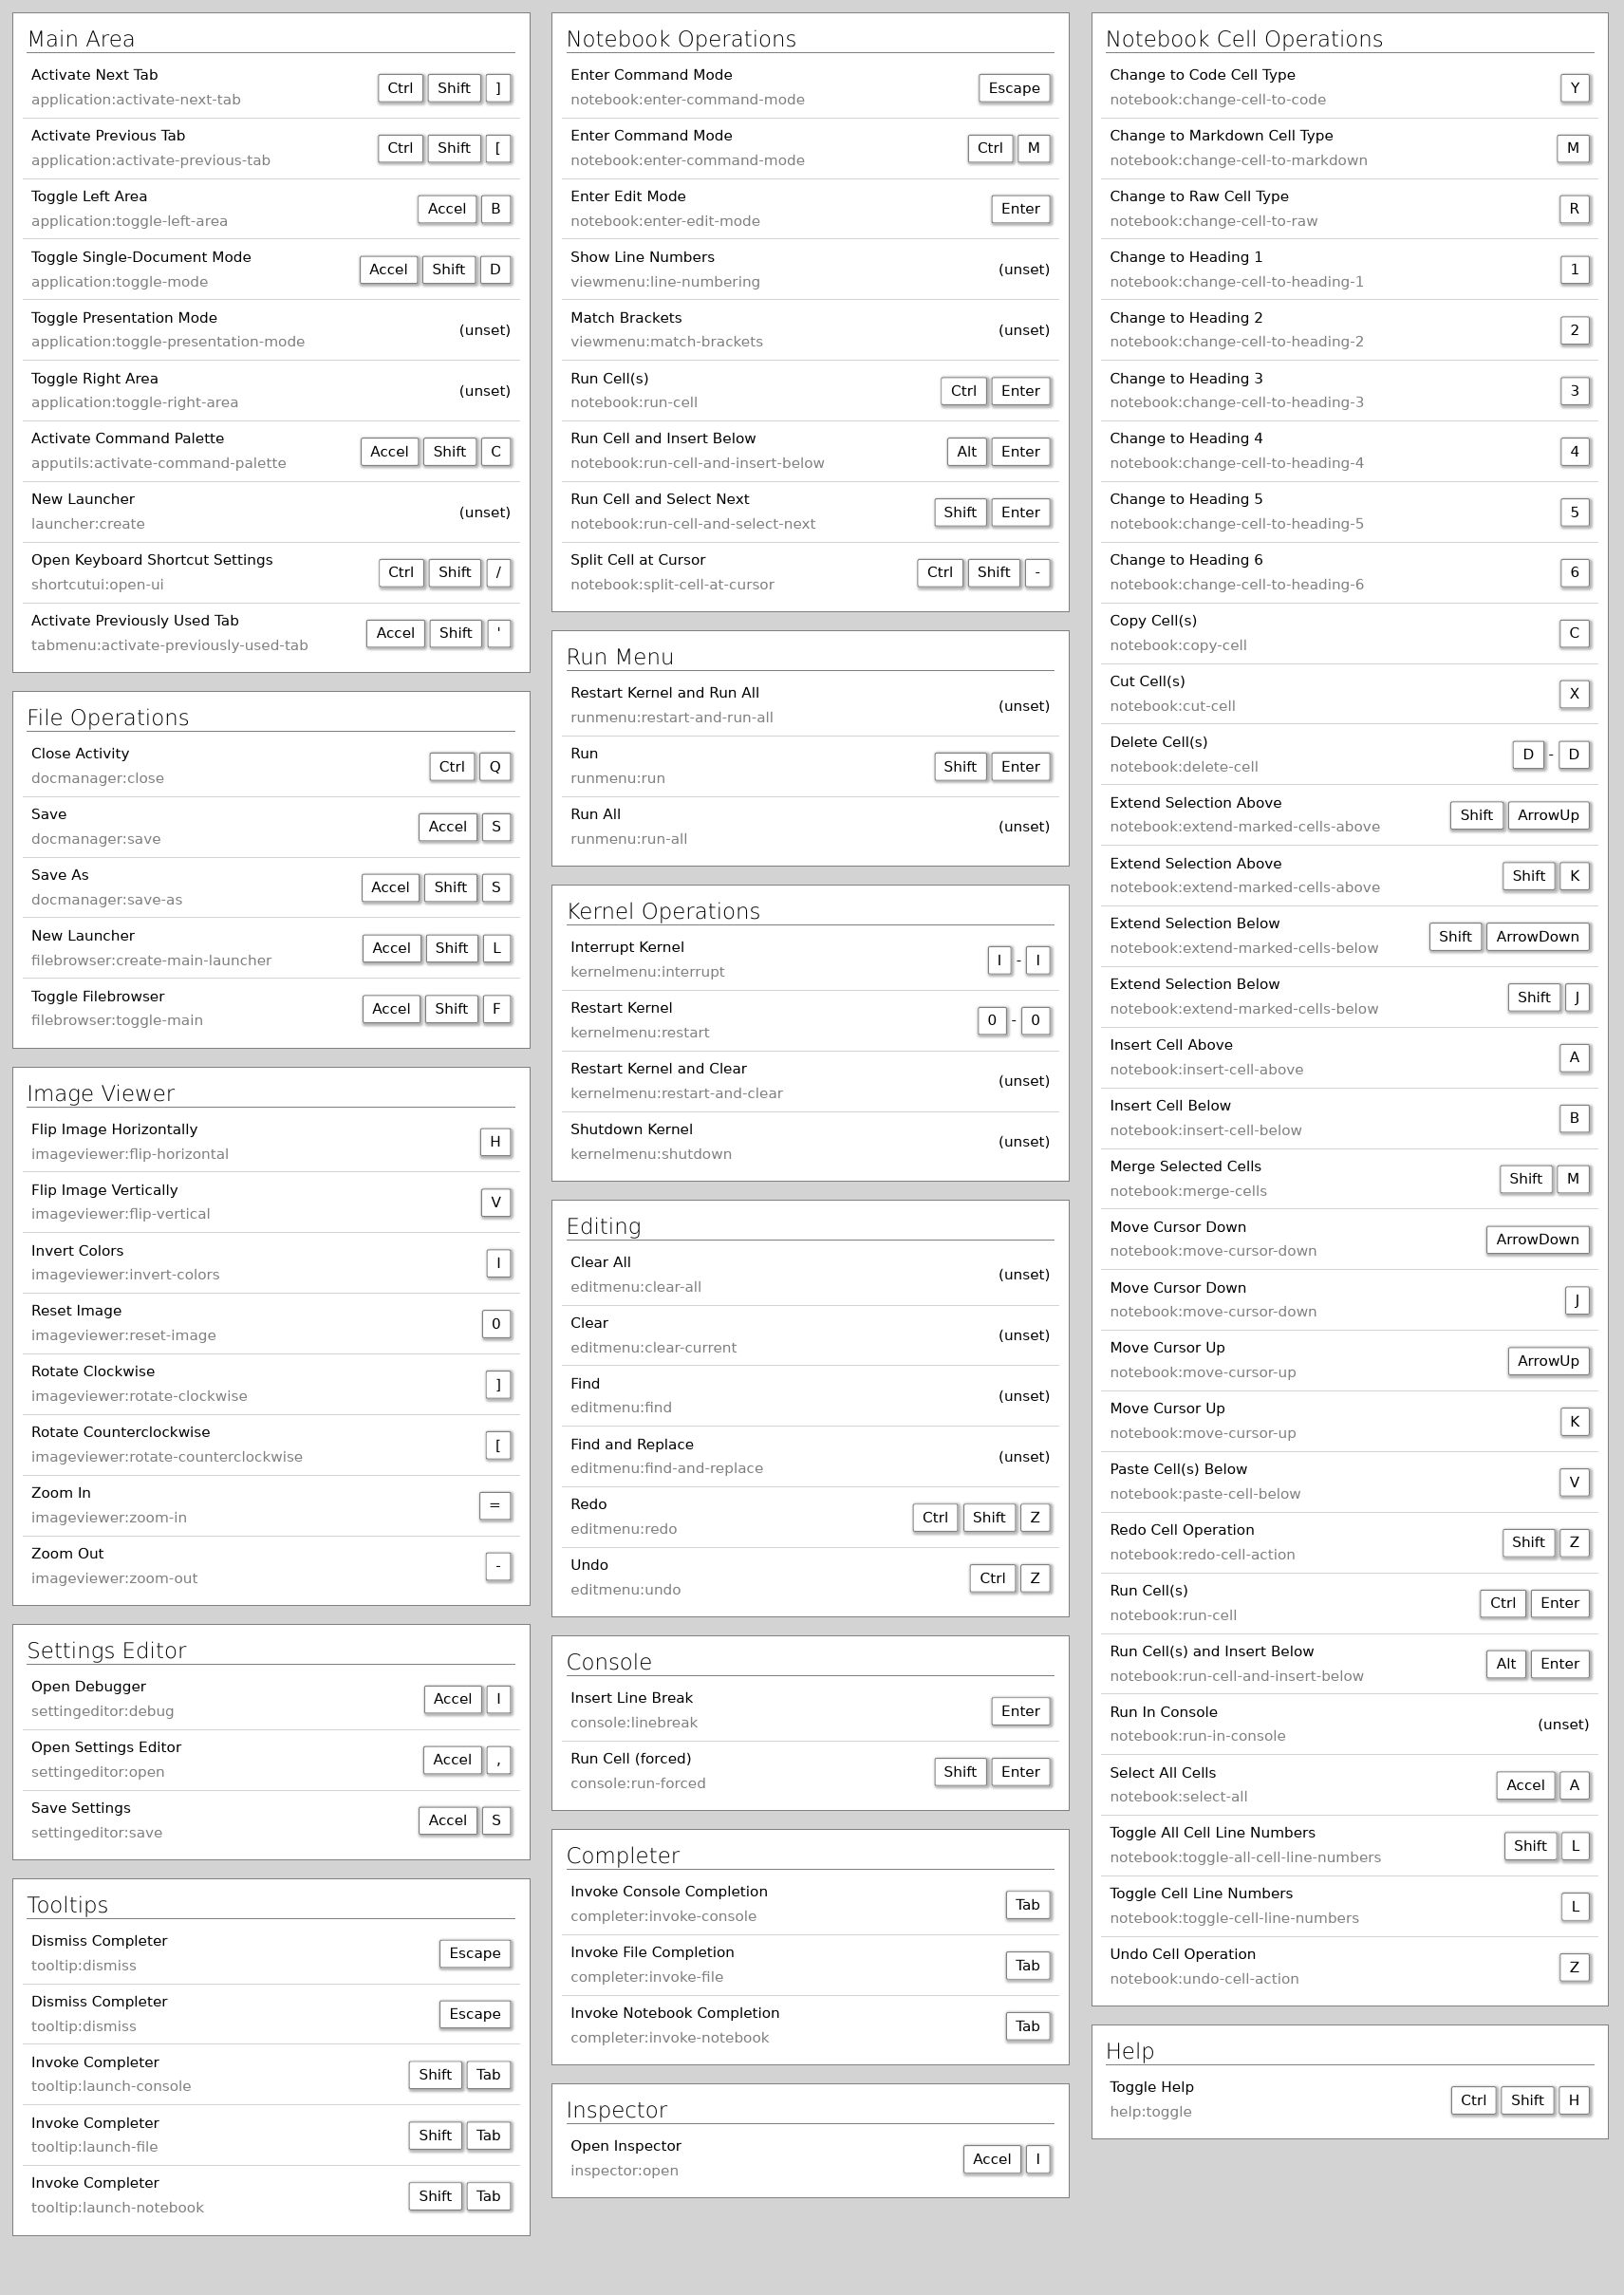
Shift + Enterruns the selected cellReturnchanges the selected cell to edit modeEscexits from edit mode, and allows you to use arrow keys to move to cells above or belowAafter hitting Esc so you are no longer in a cell will create a new cell above where you are nowBcreates a cell below the selected cellDDdeletes the selected cellMturns the selected cell to markdown cellYturns the selected cell to code cellRturns the selected cell to raw format cellCmd + Ssaves the notebook (though auto-save/checkpointing also on by default)
Click here for a cheat sheet. JupyterLab also has a text editor which has keyboard maps to popular text editors like vim, emacs or Sublime Text.

Preview your README.md
JupyterLab offers live rendering of your markdown. To set it up, locate the markdown file you want to edit in Jupyter’s file browser; right-click on the markdown file and select Open With > Markdown Preview. This will open up the file as a rendered markdown. You can then double-click on the same file again in the explorer and it’ll open in Jupyter’s Text Editor at which point you can grab and move/split the tabs to your preference for live editing of markdown.
Run Script or Only Part of Script
You can run a segment of a script by selecting the part you care about and hitting Ctrl + Alt + N. The results show up in the OUTPUT table. Take the segment of code you want to run and drop it into a new cell and Shift + Return. Seems manual but this ability to take parts of code and iterate and interact with them by dropping them into a new cell to run is what some find beautiful about Jupyter. It is like an inline console which speaking of if you want to create a new console just select File > New and you can create a new console, or a new notebook (in either a Python, R, Julia or other kernel), a terminal instance, a new text file, or a markdown.
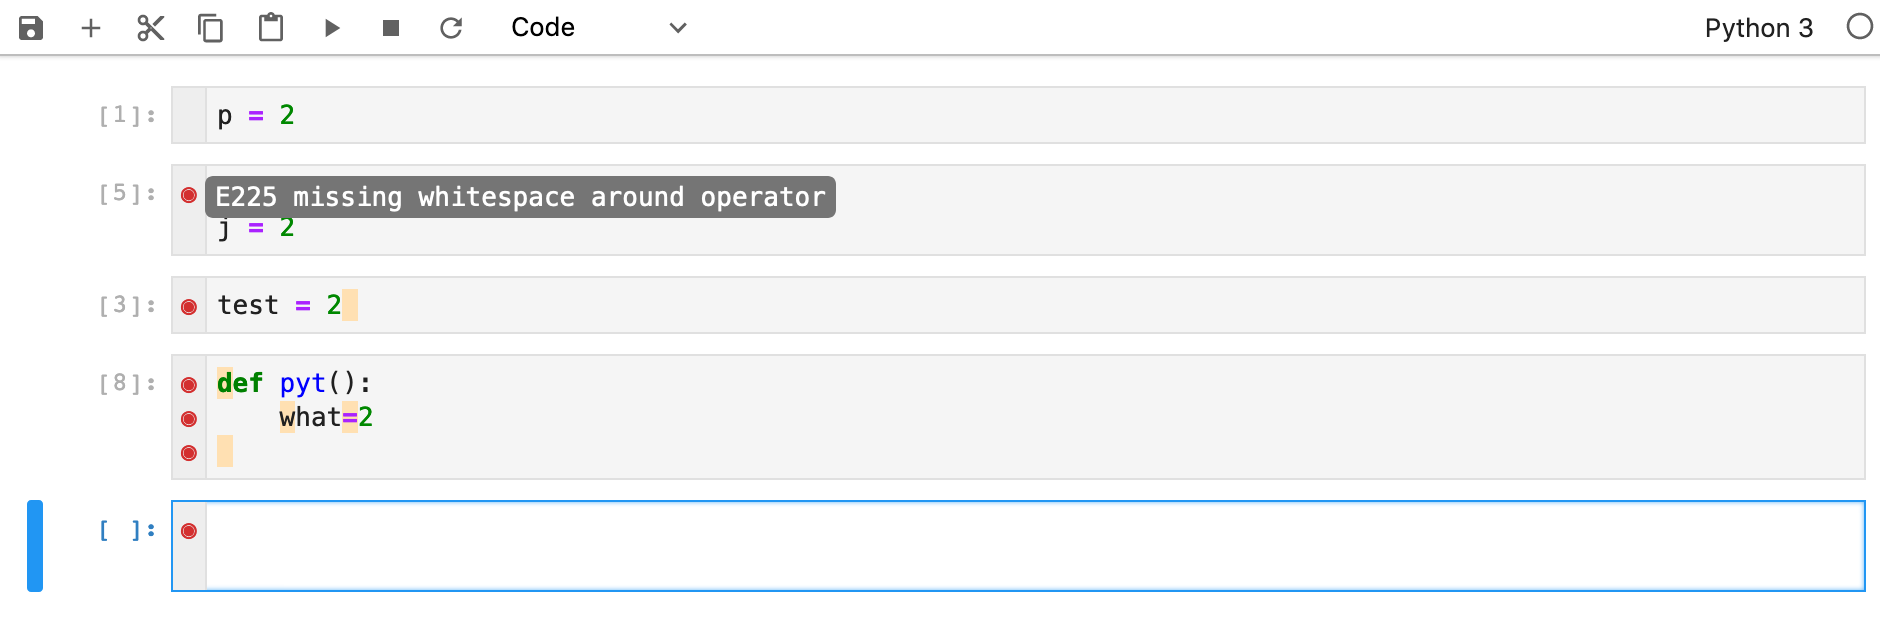
Identifying Problems and Their Quick Fixes
Linters help you find problems with your code syntax and formatting quickly. Click here to see one option implementable in JupyterLab based on the flake8 Python library for linting.

Debugging
So having a debugger in your IDE that you can insert breakpoints, step in, cycle thru your lines, and step out is nice. Once again we have a great extension here that provides that in JupyterLab. Unfortunately, after many attempts at getting the debugger switch to show up in the UI and then trying to get it to operate I had to give up on it but in version 1 it worked as a good debugger should so hopefully this will be operating smoothly in JupyterLab 2.0 soon.

Git extension for JupyterLab
“There’s an extension for that”…seriously! Yet, it’s not as nice as the GitHub integration for VS Code or PyCharm but then again JupyterLab is new and the extensions I believe are community-driven so they haven’t had the time or resources to flush it out like the others may have. There’s also one specifically for diffing and merging of notebooks.

Conclusions
JupyterLab built upon the success of Jupyter notebook as a light-weight, browser based linearly executed IDE, but now has an updated front-end making it seem more similar to RStudio and Spyder. It comes with a much quicker backend running in your browser than Jupyter notebook and with the help of some extensions which you can theoretically load by enabling the Extension Manager in Settings you can add linting, debugging, version control and many more (fasta render anyone?).