Logging in Python
Logging in Python is performed through the simple and elegant logging module which comes in the standard
Python library for both Python 2 and 3. The logging module enables developers to produce structured log messages and
direct those log messages to a variety of outputs including console, files, TCP/UDP socket, syslog, and SMTP emails.
Recommended related reference and reading relating to working with logging in Python can be found here:
Primary Audience
- Application developers, particularly those creating services which might be hosted remotely or called by other users.
- Long-running analysis/batch developers who want regular in-processing status updates / checkpoints saved for later review; in some cases if an analysis crashes and the appropriate information has been logged to that point, it may be possible to restart the analysis from the crash point.
- Anyone developing code which might be hosted on a machine separate from their own and who wants to be able to have logs available for any kind of debugging / performance analysis purposes.
Why Logging?
But I can just print stuff I need to see… why would I bother using a logger?
If you are writing applications which you expect others might use, might run for long periods of time, or are dependent on external services which could cause errors
in your application if they are not working properly, chances are you may not be able to watch all your print statements
fly across the terminal for hours on end. Or perhaps another user encounters an error while using your service, and replicating
the error is simply impossible because you don’t know what all the inputs were, whether an external service was down, or possibly
even what the error was. In these cases you’ll want to have logs detailing the use of the application leading up to the crash, hopefully
capturing what went wrong and enough parameters of the event to give you insight into how to fix the problem without necessarily having to replicate it. Python loggers
can be set up to automatically add contextual information such as line number the log message occurred on, timestamps, function / module,
stack traces, and more, all of which can be vitally important when doing post mortems on a failure.
In more advanced use cases one can use retrospective log analysis on structured logs to profile an application and view metrics
like how often components of your application are used, identify bottlenecks, and track down areas of the code where bugs
seem to occur more often. When running in AWS Lambda, EC2, ECS, or Batch, the logging module automatically routes messages
to CloudWatch, which can be essential for troubleshooting your code when executing in the cloud.
Getting Started
The quickest and simplest way to start logging is like this:
import logging
logging.basicConfig()
logging.warning('Blargh')
The logging module’s .basicConfig() method will setup the logging module to log messages of level WARNING and above (i.e. ERROR, EXCEPTION) to the console. You can
provide a format string (more on Formatter classes and adding contextual informaation later) to your .basicConfig() call to
format the structure your log messages for this logger will appear.
By itself this way of initializing your log facilities has fairly limited capabilities, but can be further customized
using some of the objects and methods listed below.
Basic Logger
Setting up a basic logger without calling .basicConfig() is very simple.
import logging

logger = logging.getLogger('new_logger')
logger.setLevel(logging.DEBUG)

stream_handler = logging.StreamHandler()
logger.addHandler(stream_handler)

logger.info('Hello world!')
If you run the code above you should see Hello world! has been output to the terminal, much like a print statement would.
Knowing this toy example doesn’t really provide any obvious additional functionality to print, let’s explore what’s
happening here.
In the first section a Logger instance is created. Next, a StreamHandler is created, which by default will send log
messages to the console. Finally, Hello world! is outputted to the console by invoking the info method on the Logger
instance.
Formating
We can quickly make this basic logger much more interesting by using a Formatter, which will add contextual information
to every log message which the Handler it is associated with emits. The contextual information is added to the string
using special key words within the %()s notation; more on this later.
import logging

logger = logging.getLogger('new_logger')
logger.setLevel(logging.DEBUG)

formatter = logging.Formatter('%(asctime)s - %(name)s - %(levelname)s - %(message)s - line %(lineno)s')
stream_handler = logging.StreamHandler()
stream_handler.setFormatter(formatter)

logger.addHandler(stream_handler)
logger.info('Hello world!')
Running this code, you should see something like this:
2020-01-23 14:46:29,928 - new_logger - INFO - Hello world! - line 11
Filtering Logs
A particularly helpful aspect of logging statements is the different contextual levels they have, allowing you to filter
out log messages of different severity without redeploying the code. For instance, I could use an environment variable or
configuration file where the desired log level is set. When the program runs this could be used to set the logging
module level, meaning all logging calls below that won’t get reported. As an example you might want a bunch of .debug()
calls around a particularly tricky piece of logic when running in your test environment, but perhaps want to ignore .debug()
and only see.error() and above messages in another environment. You could have a LOG_LEVEL environment variable which
is then used in the code to set your logger levels to their desired state, without having to touch the code. Example below:
import logging
import os

LOG_LEVEL = os.getenv('LOG_LEVEL')

logger = logging.getLogger('new_logger')
logger.setLevel(LOG_LEVEL)

formatter = logging.Formatter('%(asctime)s - %(name)s - %(levelname)s - %(message)s - line %(lineno)s')
stream_handler = logging.StreamHandler()
stream_handler.setFormatter(formatter)

logger.addHandler(stream_handler)
logger.info('Hello world!')
Now let’s examine the different components of a Logger to better understand what’s going on under the hood.
Anatomy of a Logger
Logger
A Logger instance is created when logging.getLogger() is called. Without any arguments this method returns a reference
to a global root logger instance, which is stored in the logging module. By providing a string representing a name to
getLogger() a child logger of the root logger is created. Loggers have a concept of log propagation up a chain of related
parent-child loggers, which can be useful in more complex situations but will not be covered here. For more information on
hereditary log propagation please see the Python Logging Cookbook
and / or the Python Logging Docs.
Handlers
A handler is a critical component of a Logger instance, and provides protocols for directing log messages to a wide variety
of different possible output sources. Some of the more common handlers include StreamHandlers for writing to various output
streams such as STDOUT and STDERR, and FileHandlers for writing records directly to a file. It is common to want to see the output of your
code in the terminal when you run it, but you might also want output logged to a file somewhere in case your project is run on a cron or run
by other remote users. There are a lot of different types of handlers, including email, socket handlers, rotating file handlers, HTTP handlers, and more but I’m not going into them here.
Different log handler classes can be found listed here
Formatters
Formatter objects determine the structure that every message will be reported in, and allow you to add contextual information
to every log message, such as line number, module name, function name, and date / time. The list of contextual information
you can add to your message by embedding the key words into your Formatter string can be found
here. Some of the attributes I find myself using
quite often are %(lineno)d (line number), %(asctime)s (timestamp), %(filename), (funcName)s, and %(module)s.
There are also some handy formatting attributes for reporting what thread or process a message is coming from if you’re
working in a concurrent environment.
When creating a Formatter object, it simply must be added to a Handler class instance using the .setFormatter() function,
as seen in the earlier example. By attaching different Formatter objects to different handlers, you can provide different levels
of detail to different outputs. For instance maybe I don’t want the module, function, and file name cluttering up
my console, so I could attach a formatter to it which doesn’t have those attributes. But I want my file handler to have as
much information as possible so I can better reconstruct events when doing retrospectives (example below).
import logging
logger = logging.getLogger('new_logger')
logger.setLevel(logging.DEBUG)
file_formatter = logging.Formatter('%(asctime)s - %(levelname)s - %(message)s - line %(lineno)s - module %(module)s - function %(funcName)s - file %(fileName)s')  # File record formatter provides lots of information, better for automated log analysis and post-mortems
file_handler = logging.FileHandler(filename='verbose_logger.log', mode='a')  # define where the log will be written.  mode parameter will determine whether to append to log if it exists ('a') or write over file ('w').
file_handler.setFormatter(file_formatter)

stream_formatter = logging.Formatter('%(asctime)s - %(levelname)s - %(message)s - line %(lineno)s')
stream_console_handler = logging.StreamHandler()
stream_console_handler.setFormatter(stream_formatter) # Stream formatter carries less information to clutter up terminal less
logger.addHandler(stream_console_handler) # Now log messages recorded by logger will be printed to console
logger.addHandler(file_handler)  # Now log messages recorded by logger will be recorded to file specified in logging.FileHandler() call
Filters
Filters are attached to Handlers and provided filtering of messages from below a specified point in the logger hierarchy
of which the Logger that the attached Handler is a part of. We didn’t go through logger hierarchies too much, but say
we have a logger hierarchy like:
- base_logger
- - module_logger
- - debug_logger
where the parent-child relationships of our loggers can be described as base_logger.module_logger and base_logger.debug_logger.
A Filter object can be attached to a Logger instance in order to prevent it from propagating messages from specific parts of the
logger hierarchy. Filter objects can also be attached to specific handlers as well, in order for more nuanced control of which loggers
are emitted to a particular output location.
For instance, if we were to want to have messages from our module_logger propagate to the base_logger, but did not want any messages
from debug_logger propagating up to the base_logger and its handlers, a Filter object could be attached to the base_logger
specifying that it should ignore any messages recorded by debug_logger
Log levels
Both Logger and Handler instances have an attribute called .level, which determines the severity of messages the
Logger will emit. Each log level is represented by a decimal number internally, although they can be referenced in a
variety of ways. The following table shows the various built-in log levels (although one can create their own log levels
as well).
| Level | Int Representation | String Representation |
|---|---|---|
| DEBUG | 10 | ‘DEBUG’ |
| INFO | 20 | ‘INFO’ |
| WARNING | 30 | ‘WARNING’ |
| ERROR | 40 | ‘ERROR’ |
| CRITICAL | 50 | ‘CRITICAL’ |
It is also possible to create your own log levels, a process which is described in the Logging Cookbook.
Where/When to Implement Logging
I like to log early and log often, especially during the development phase of a project. In particular, I find often
find myself logging the responses to remote calls so I can always have a reference in my log of what the response looked
like before I start processing it. When writing REST APIs I often will log the raw request prior to any processing, so
that when something goes wrong I can look at what data I started with and investigate from there. I’ve found logging to
be invaluable for debugging stateless applications in AWS, as they pick up log messages emitted to STDOUT from your program so I
can log state at various points in the application to better understand what might have gone wrong. In most of my projects I
create a function to create or retrieve a pre-configured Logger instance early on, and use it constantly. I then use
environment variables to set the log level of the service to reduce log message volume once the service is more stable.
A simple log function that I often keep in the src/init.py folder of my projects often looks like this:
import logging
def get_logger(log_name:str = None, stream_logging_level: str = logging.INFO, file_handler: bool = False,
               log_file_path: str = ''):
    """ Create a logging instance that will log to console (or Cloudwatch if running on AWS), with an optional file handler.
        Logging levels can also be set using the top-level constants provided in the logging module, or an integer value
        corresponding to the desired logging level as described in the documentation.  When file logging is enabled logs
        will be printed in the /logs subdirectory using the file name 'registrar_log_{YYYYMMDD}.txt', where YYYYMMDD
        represents a day of log captures.
    """
    if not log_name:
        log_name = 'base_logger'

    logger = logging.getLogger(log_name)

    logger.setLevel(logging.DEBUG)
    ch = logging.StreamHandler()
    ch.setLevel(stream_logging_level)

    formatter = logging.Formatter(
        '[%(levelname)s] | %(asctime)s | %(message)s | Function: %(module)s.%(funcName)s | lineNumber: %(lineno)s |')
    ch.setFormatter(formatter)
    logger.addHandler(ch)  # Now any messages recorded with logger.info() will be send to the console

    # Add file handler if requested by caller - could be set by an environment variable as well.
    if file_handler:
        if not log_file_path:
            raise Exception(f"Log handler file path {log_file_path} is in a directory that doesn't exist")

        fh = logging.FileHandler(filename=log_file_path)
        fh.setLevel(logging.INFO)
        fh.setFormatter(formatter)
        logger.addHandler(fh)  # Now any messages recorded with logger.info() or higher will be sent to the console via
                               # the earlier-attached stream handler, as well as to a file by the newly attached FileHandler.

    return logger

    return logger
Logging and AWS
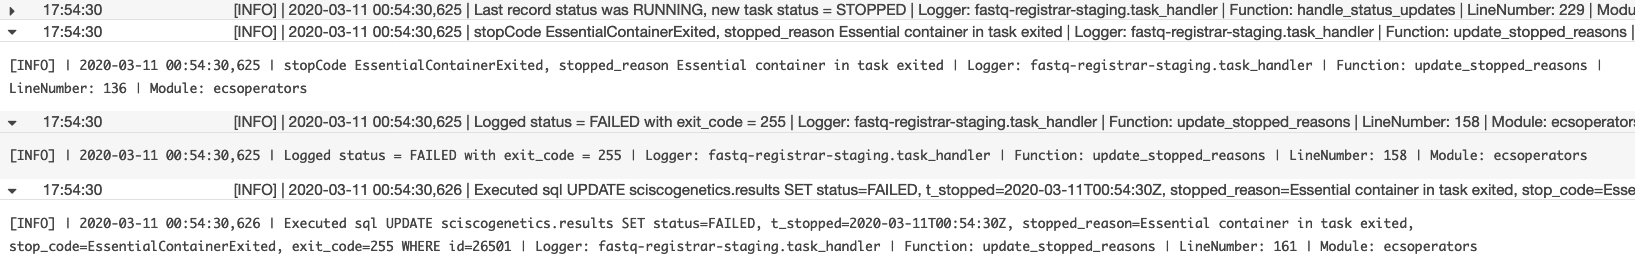
As mentioned before python logging instances will emit their log records to the AWS CloudWatch log group / stream for most of their services (I’ve seen it wth EC2, ECS, Batch, and Lambda so far). By leveraging structured logging through python’s custom log formatting, you can start to use CloudWatch Insights to query across log groups for messages pertaining to any of the attributes you’re logging.
Log messages a presented in a pretty nice format on CloudWatch:
While it’s not necessary to use in order to produce log messages to CloudWatch, there is a project out there called
WatchTower which can really help consolidate your logs into particular user-story
focused log streams that can track logs from across multiple services if they all use WatchTower to point to the same log
group / stream. I’ve found WatchTower helpful for consolidating Lambda logs as by default a new stream is created for
every new lambda instance, which can get really confusing, particularly if you have concurrent executions. I have had
some issues (which may have more to do with how I’m creating the WatchTower handlers and my application structure)
with some of the functions hitting AWS service limits on API calls like Create/DescribeLogGroups and Create/DescribeLogStreams,
which can have have an affect on responsiveness and at worst can crash the Lambda call if the exceptions aren’t handled properly.
This is particularly the case when the service is under a high load. If someone has another solution for this I’d love to hear about it!